Investigate anomalies
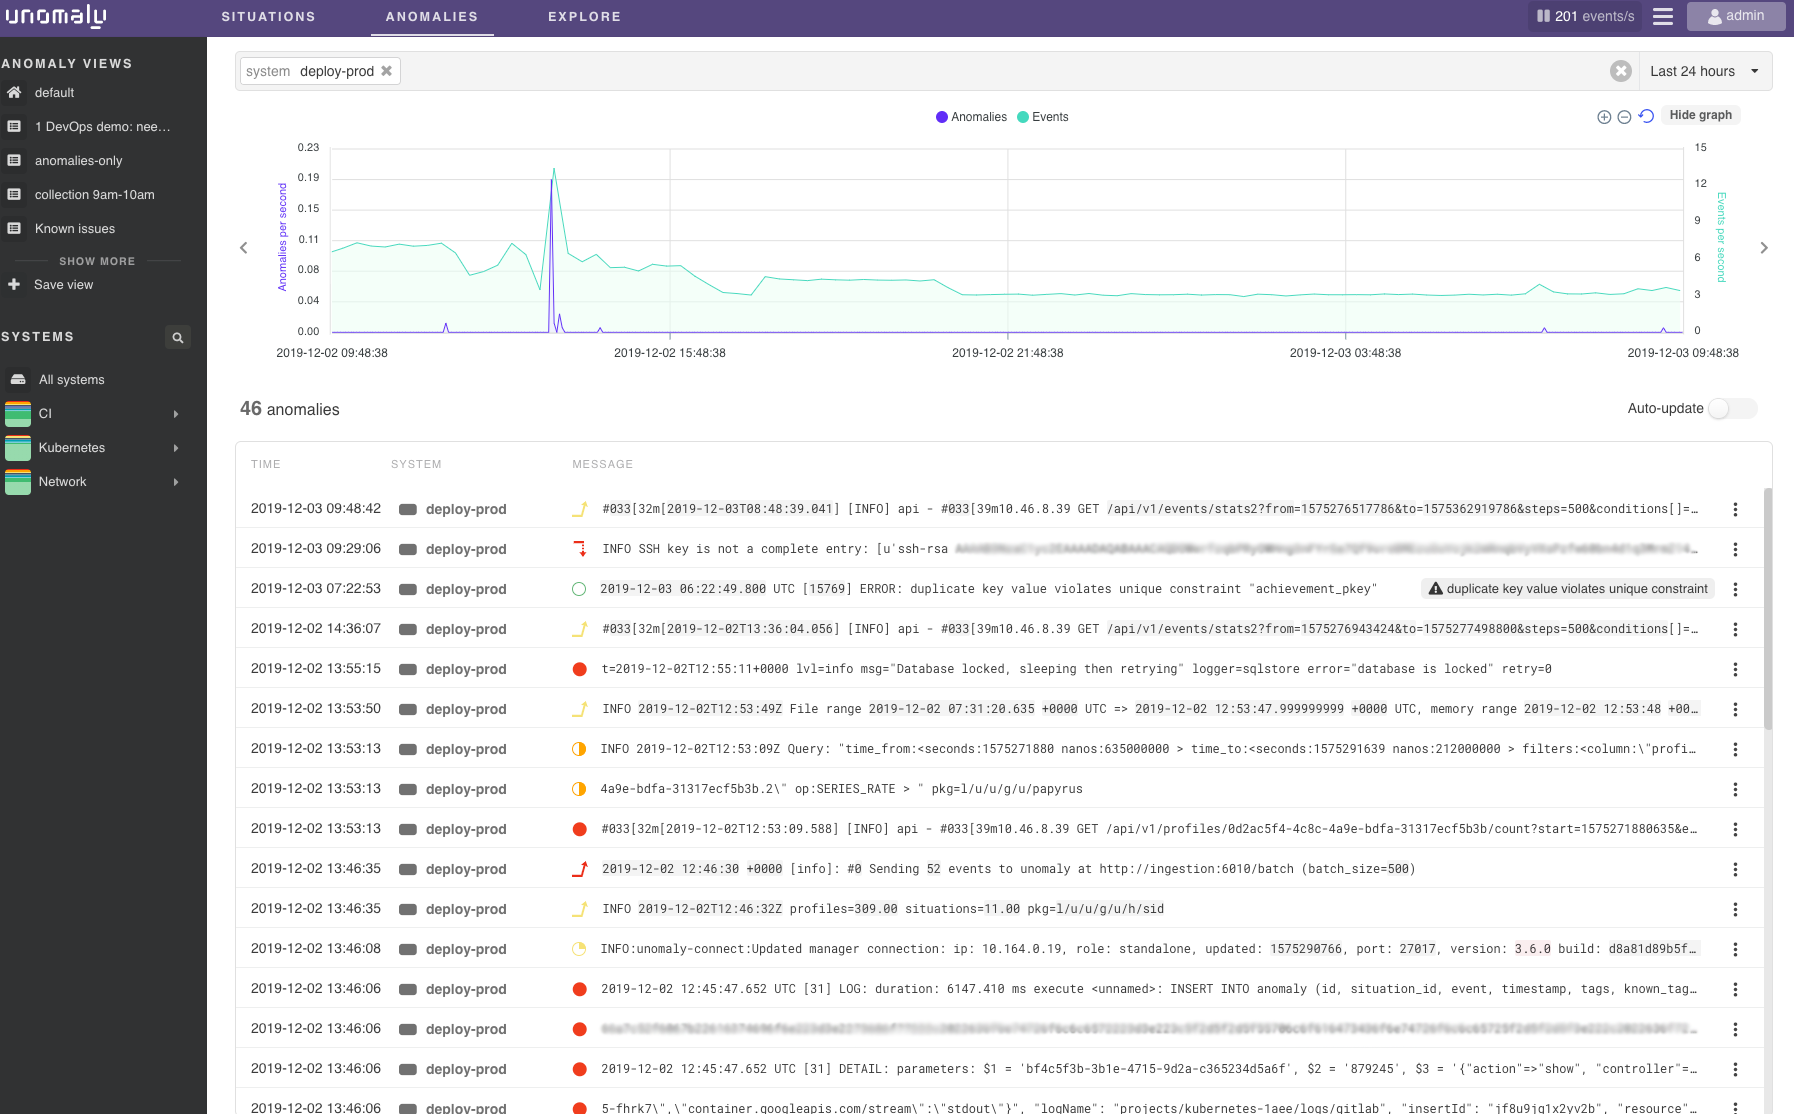
An anomalous event is any event that doesn’t match the historic pattern of events from the source (system) of the data. On the Anomalies page, you can use the search bar, conditional filters, time range selector, or the graph to narrow down on specific anomalous events.
Anomaly types
Unomaly detects anomalies based on the log event structure that it parses and based on the frequency changes or the stops of periodic log events. The following table describes the types of anomalies that Unomaly detects.
| Anomaly Type | Description |
|---|---|
| Never before seen | Events that are new in the entire IT environment that Unomaly is monitoring. |
| New in system | Events that are new in a system but may have occurred in other systems. |
| Parameter change | Events that match previously detected anomalies but have different parameter values. |
| System away | Events indicating that Unomaly has not received data from the system for a certain amount of time. |
| Frequency spike | Anomalies where an event is produced at a significantly greater rate than previously seen. |
| Event stop | Anomalies where a periodic log event (that is an event that was seen regularly) is no longer produced. |
Expanding and reviewing individual anomalies
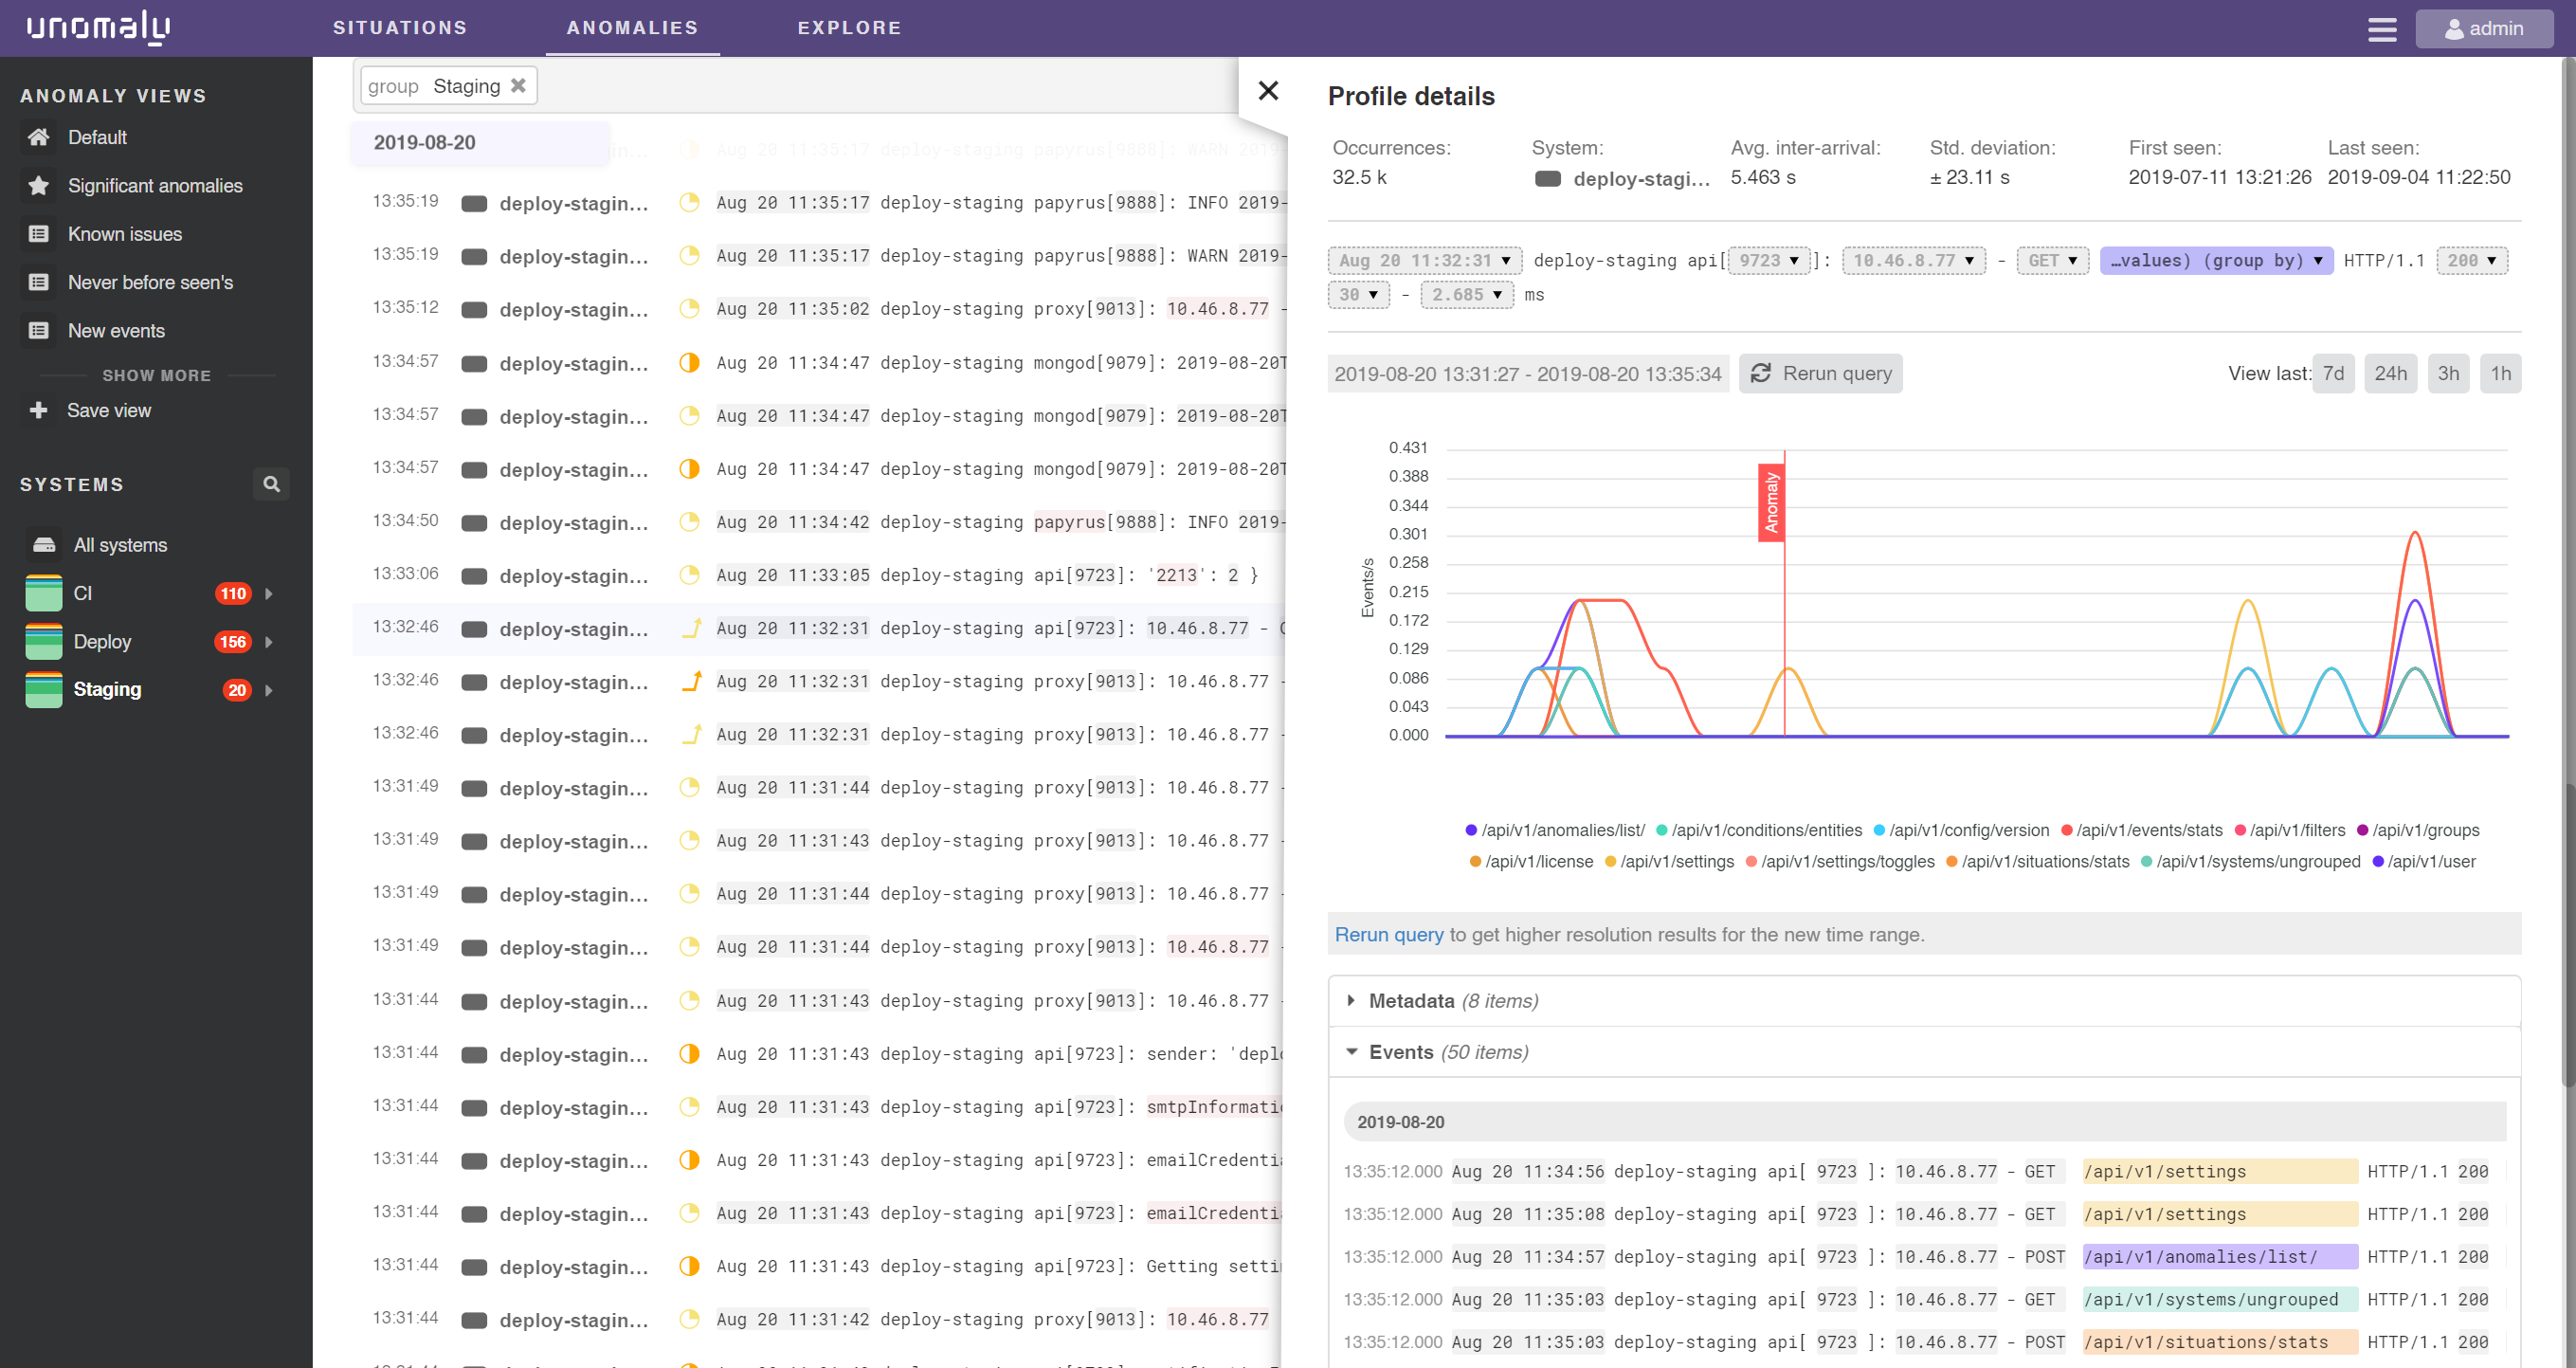
When you click an anomaly it will open a side panel to display information about the associated profile where the anomaly was triggered.
- The profile details includes information about where the event was seen, when it was seen, how many times it was seen, and the average time between occurrences. Unomaly uses this information to detect and classify different types of anomalies.
- Under the profile details, Unomaly breaks down the structure of the log event into static and dynamic parts. You can filter and run queries on the individual parameter values or use the group-by function. Unomaly tracks up to 100 values for each dynamic parameter.
- The time series graph displays the occurrences of the profile in events per second. You can zoom in or out of the graph and select time presets to change the time range of the graph. A marker on the graph indicates where the anomaly you clicked occurred.
- You can also view the metadata associated with the anomalous event and the original log line of the anomaly.
Event menu
To the right of each event is an event menu with the following options:
- “Copy log text” to copy the full log message to your clipboard that you can use to search or investigate outside of Unomaly.
- “Add known…” to open the knowns creation window.
- "New Transform..." To create a transform to merge tokens in your log message.
- “Share..." To share the anomaly with other users.
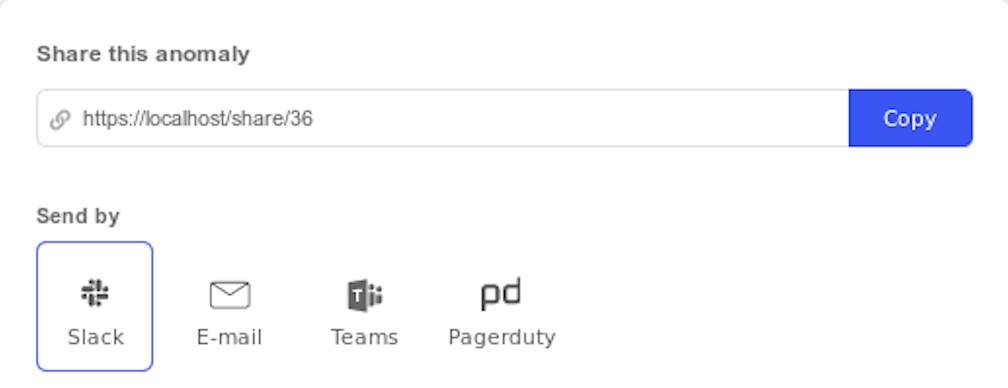
Share an anomaly
Select Share from the event's menu to choose how to send the anomaly to other users, such as via email, to a channel or app you've configured in the Settings> Plugins, or with a dedicated link you can copy.
Users can access and manage their share history from their account menu. The Share History page lists all the situations and anomalies that you have shared, who has viewed it, and where you sent it to.
Investigating with the graph and time range
The timeline in the Anomalies page depicts the total volume of data that Unomaly analyzed in the time range of the graph. As you hover over individual sections of the bars, you can see how many events and which requency of events they correspond to. As you scroll down through the list of situations, the graph remains visible. But, you can also choose to hide it by clicking "Collapse".
Adjusting the time span
The span of the graph can be changed longer and shorter by using the dropdown to select from presets, which include last day, last week, last month; or use the custom option to specify a specific time range.
Jumping back and forward in time
Arrows to the left and right of the graph are buttons that allow you to jump forwards and backwards in the graph with the preserved interval selection. If you are looking at last day and clicking the arrow to the left of the graph it will take you to the previous day.
Zooming in and out on selected time periods
Making selections in the graph dynamically applies a filter for the situations and events that happened in that specific time frame. When making this selection a zoom button will be presented above the graph that enables you to zoom in on that specific part of the graph.