Explore system activities
Explore helps you to understand the state of your systems and the data that Unomaly has seen and processed. While Anomalies and Situations focus on what's different in your logs, Explore focuses on the running state of your infrastructure, whether it is normal or not.
You'll notice that some of the pages in Explore are labeled "beta". In upcoming releases, we will add more dynamic visualizations and experiments. The "beta" label will help you to see what is new or still under development. You can use the "Was this helpful?" button on the bottom right of the Explore page to send us your feedback.
Event profiles
Event profiles lets you explore all the types of events Unomaly has identified in your infrastructure. Similar to Anomalies and Situations, you can use filters to search for profiles and create knowns.
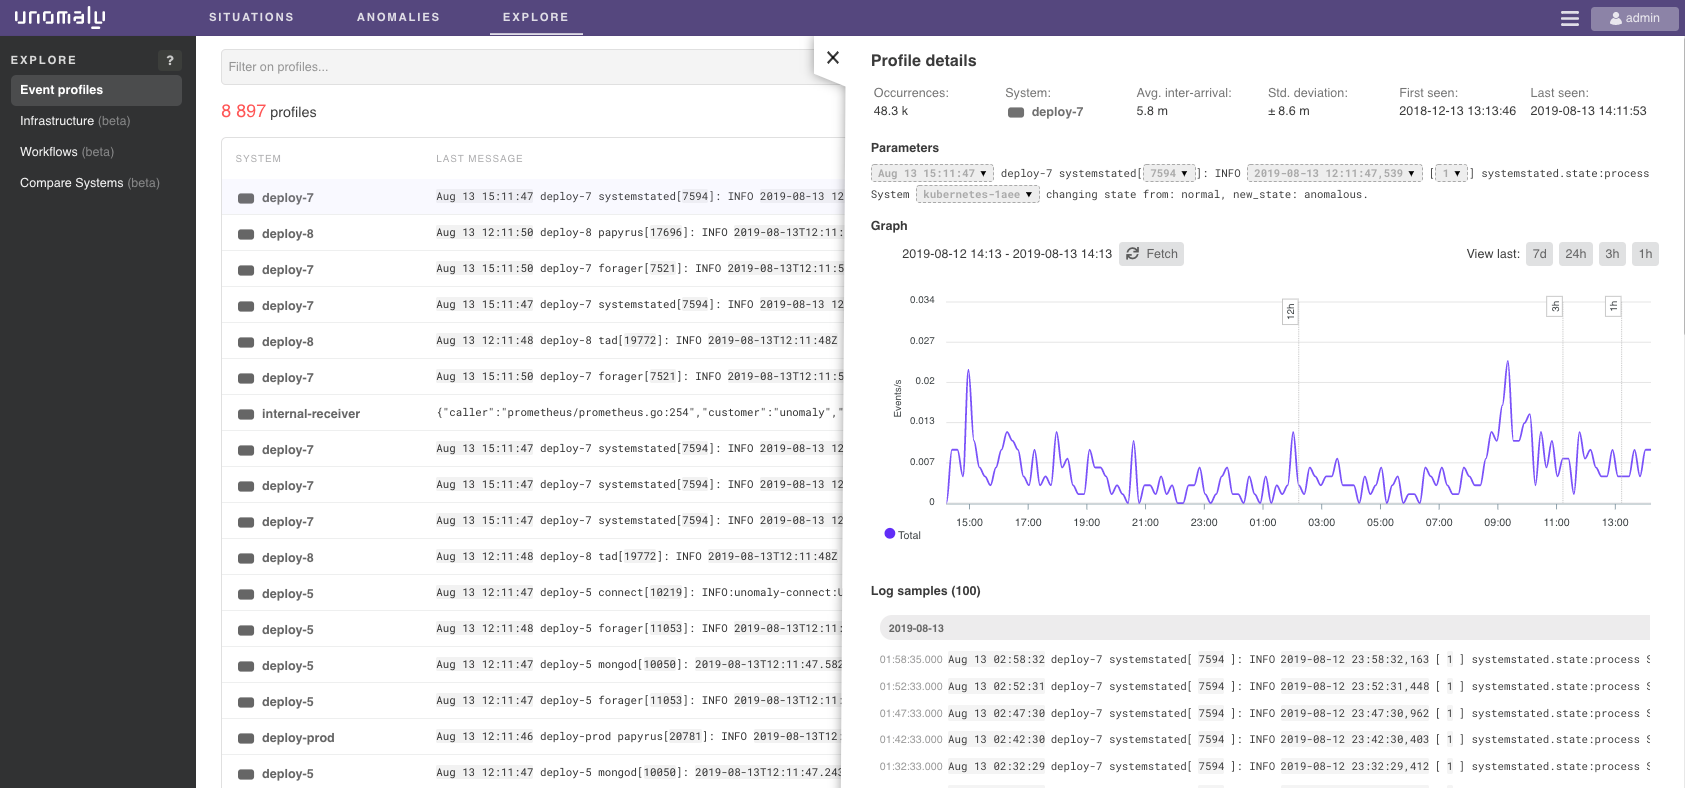
Click on the event profile to open the interactive Profile details side panel which gives you additional details about each profile lets you query sampled events that Unomaly receives.
- The profile details includes information about where the event was seen, when it was seen, how many times it was seen, and the average time between occurrences. Unomaly uses this information to detect and classify different types of anomalies.
- Under the profile details, Unomaly breaks down the structure of the log event into static and dynamic parts. You can filter and run queries on the individual parameter values or use the group-by function. Unomaly tracks up to 100 values for each dynamic parameter.
- The time series graph displays the occurrences of the profile in events per second. You can zoom in or out of the graph and select time presets to change the time range of the graph.
- You can also view sample of the events that match the profiles.
Each profile line has a menu to the right with options to perform other tasks, such as:
- Choose "Add known" when you want Unomaly to continue tracking a log event. See "Define knowns to highlight log events".
- Choose "Copy log text" to copy the full log message to your clipboard that you can use to search or investigate outside of Unomaly.
| Field | Description |
|---|---|
| Count | The total number of times this profile was seen. |
| First seen | Timestamp for the first occurrence of this profile. |
| Last seen | Timestamp for the most recent occurrence of this profile. |
| Periodicity | The mean time between events matching this profile. |
| Standard deviation of the periodicity | A very low standard deviation can indicate that a task is periodic. For example, it may be a cron job. |
Infrastructure (beta)
Infrastructure displays a realtime bubble chart visualization of the current state of your systems and groups and helps you quickly see which systems are currently behaving differently from others. You can use the filter bar to select and view different groups.
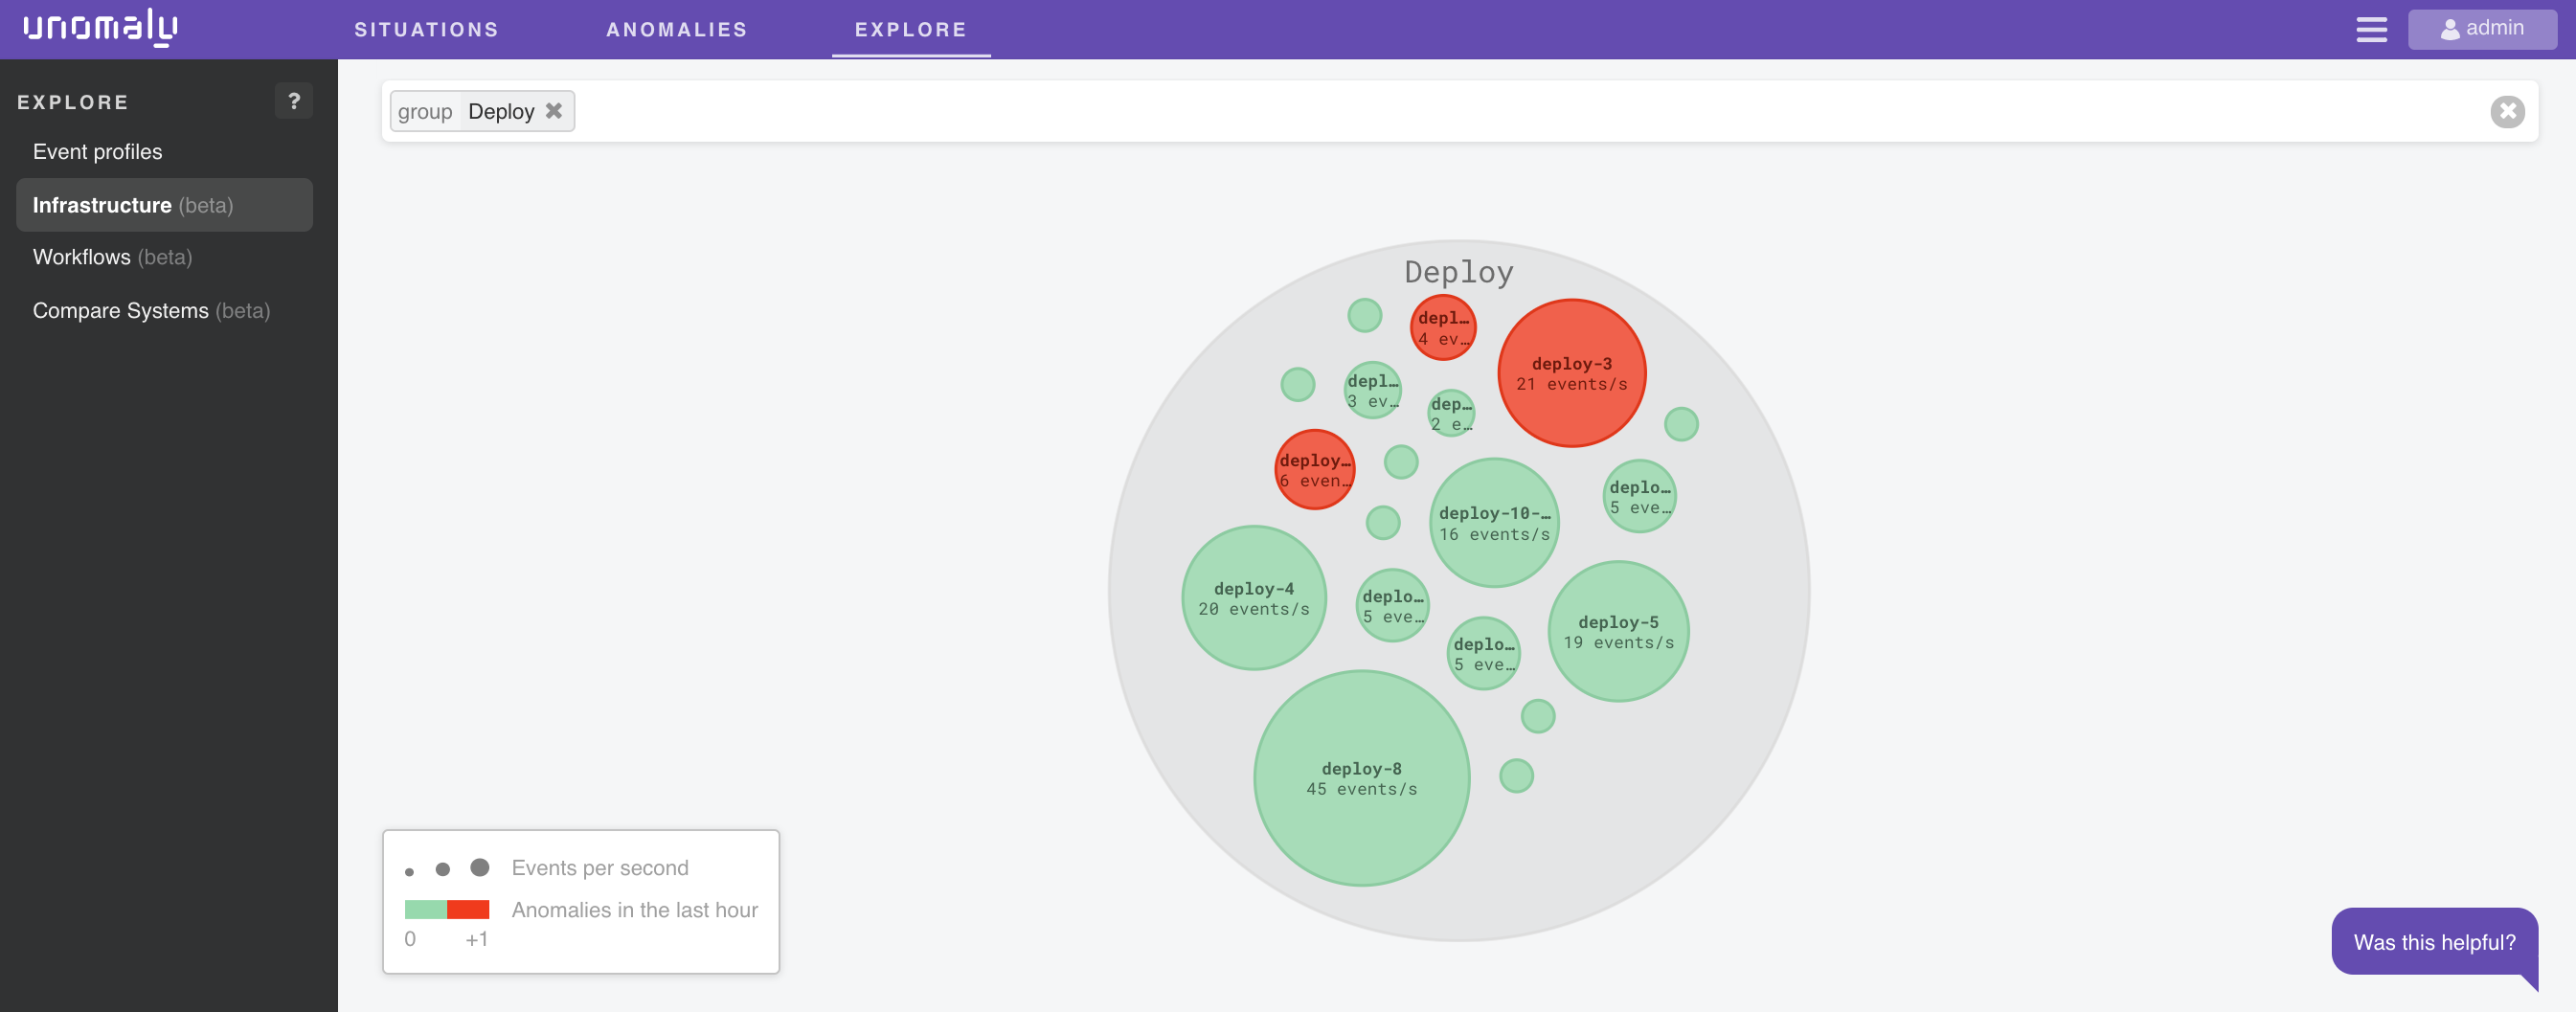
Each bubble represents a system. The diameter of a bubble is proportional to how many events per second this system is producing. A bubble is red if the system it represents has experienced anomalies within the last hour.
- Hover over a system bubble to see the count of events per second and the number of anomalies seen in the last hour.
- Click the center of the bubble to redirect you to the Anomalies page filtered on the system you selected.
- Click on other areas of the bubble to zoom in to the system.
Compare systems (beta)
Compare systems allows users to visually compare the profiles between two systems, A (purple) and B (green).
Check the boxes or click the parts of the Venn diagram to select the different combinations to show. The default result set is the union of the log events happening on A and B. You can also use free text search and select different time ranges to narrow the result set further.
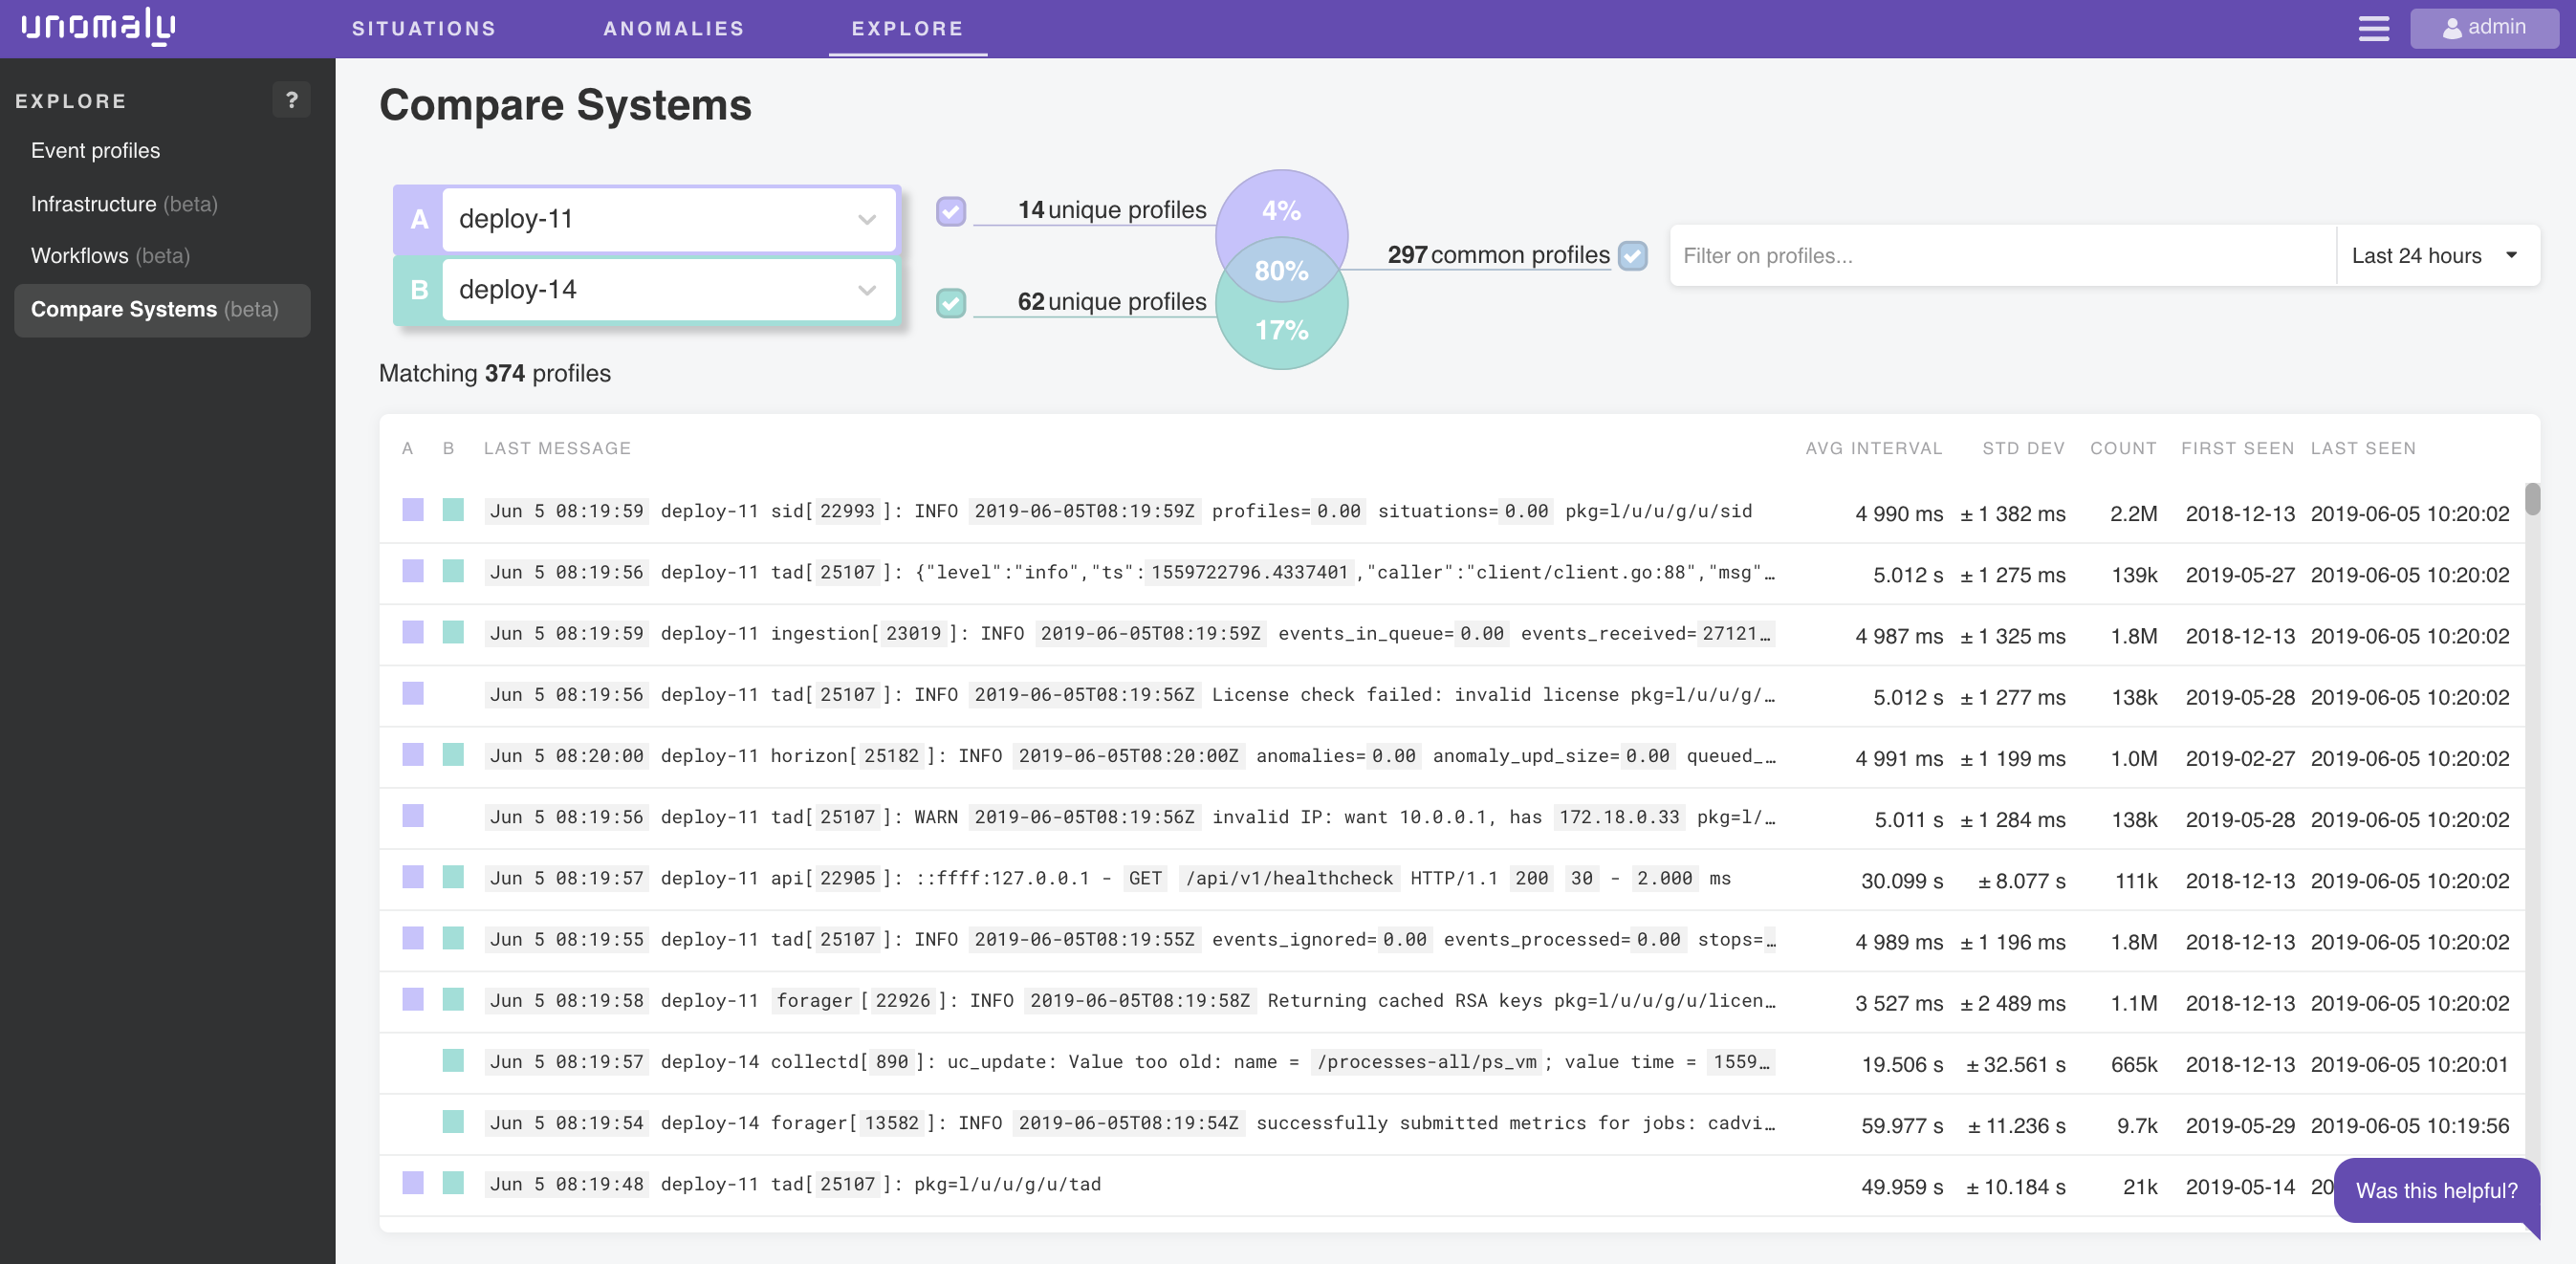
The purple and green icons in the list indicate which system the profiles belong to so you can easily see what's unique to each system
The combinations you can choose to compare systems include: profiles that happen only on A, only on B, on both A and B, only on A and only on B (the symmetric difference), on A, on B, and everything on A and B (the union of the two systems).