 By Göran Sandahl in Technology, Product • July 18, 2019
Observing Google Cloud Platform Services Best Practices
Google Cloud Platform (GCP), offered by Google, is a suite of cloud computing services that runs on the same infrastructure that Google uses internally for its end-user products, such as Google Search, Gmail and YouTube. Google Cloud Platform provides infrastructure as a service, platform as a service, and serverless computing environments. It also offers a wide array of management tools and modular cloud services including computing, data storage, data analytics, machine learning and monitoring/observability.
Extending observability in GCP
Google Cloud Platform offers a basic set of monitoring capabilities baked into the platform. Virtually anything that runs on top of GCP will get basic monitoring through health checks, basic alerting and basic log management. These are available as Stackdriver services.
With Unomaly, you can extend these capabilities to get deep insight dynamic running state and behavioral anomalies of your entire base of entities running on top of GCP, by algorithmically analyzing the log data generated by those services. For example:
- Cloud functions to get a behavioral view of workloads running as serverless functions. All cloud functions logs to Stackdriver and is ideally profiled on the function level.
- Containers running on GKE to get a behavioral view of container workloads. All containers running on GKE automatically logs to Stackdriver and is ideally profiled on the container type level. Typical anomalies are everything application related.
- Virtual instances to get a behavioral view of the full stack of computing instances. Logs are shipped to Stackdriver by using the GCP logging agent.
- Other GCP services such as BigQuery, data studio and GKE can be monitored too as they also log directly to Stackdriver.
This would allow you to address a set of key cloud monitoring and observability challenges derived from the data already generated.
- Which software entities and types do we currently have running in GCP?
- What are they doing? I.e. what are the patterns of the events they producing, what parameter combinations, at what frequencies.
- What has changed? I.e. have there been new events, errors or exceptions now and over time. New sets of parameters for otherwise normal events, or large change in frequencies in the data that they output?
- How do these compare? I.e. what is different between our functions running in one zone vs another? Or how different is our staging nodes from our production nodes?
Logging in the GCP ecosystem
Stackdriver is the default destination for all logs in the GCP ecosystem. Many of the GCP services and code running on top (resources) log automatically, such as Cloud Functions and Containers. Additionally, all API-activity and user audit logs are logged there automatically. Google also recommends that logs from virtual instances are forwarded by their Fluentd-based agent.
Example Stackdriver log record. Stackdriver log records are structured as Json and contain the messages sent by the software resource, along with metadata that is added by the logging pipeline. The meta data explains when and where the entry was originally created.
{
insertId: "000011-8764bc6d-0e5e-44d2-ade0-14193c6f6c83"
labels: {
 execution_id: "539027578310035"
}
logName: "projects/kubernetes-1aee/logs/cloudfunctions.googleapis.com%2Fcloud-functions"
receiveTimestamp: "2019-05-15T08:26:26.717277642Z"
resource: {
 labels: {
  function_name: "upload_new_forager_data"
  project_id: "kubernetes-1aee"
  region: "europe-west1"
 }
 type: "cloud_function"
}
severity: "ERROR"
textPayload: "  File "/env/local/lib/python3.7/site-packages/google/cloud/functions/worker.py", line 333, in run_background_function"
timestamp: "2019-05-15T08:26:17.194Z"
trace: "projects/kubernetes-1aee/traces/09f4f5b8730da2b92eaada66ff0e673e"
}
Besides simplifying collections of log data, GCP is also exposing log data. This allows Unomaly to seamlessly integrate with GCP.
Best practice configuration for Unomaly and GCP
Using Unomaly you can monitor software entities by profiling events from sources. An important part of ingesting data from a source into Unomaly is to define the ideal profiling key, message key and meta data for the analysis to become optimal. The optimal message key and source key is typically dependent on the type of source since they dictate their own logging. Part of doing this integration is defining this set per resource.
To help you get started with GCP quickly, we have assembled Fluentd-based configuration syntax for various services. In production scenarios, you would likely automate this with Terraform or a similar tool.
In this example, we are about to monitor an environment consisting of virtual instances. The starting point is to expose Stackdriver logs to be consumable:
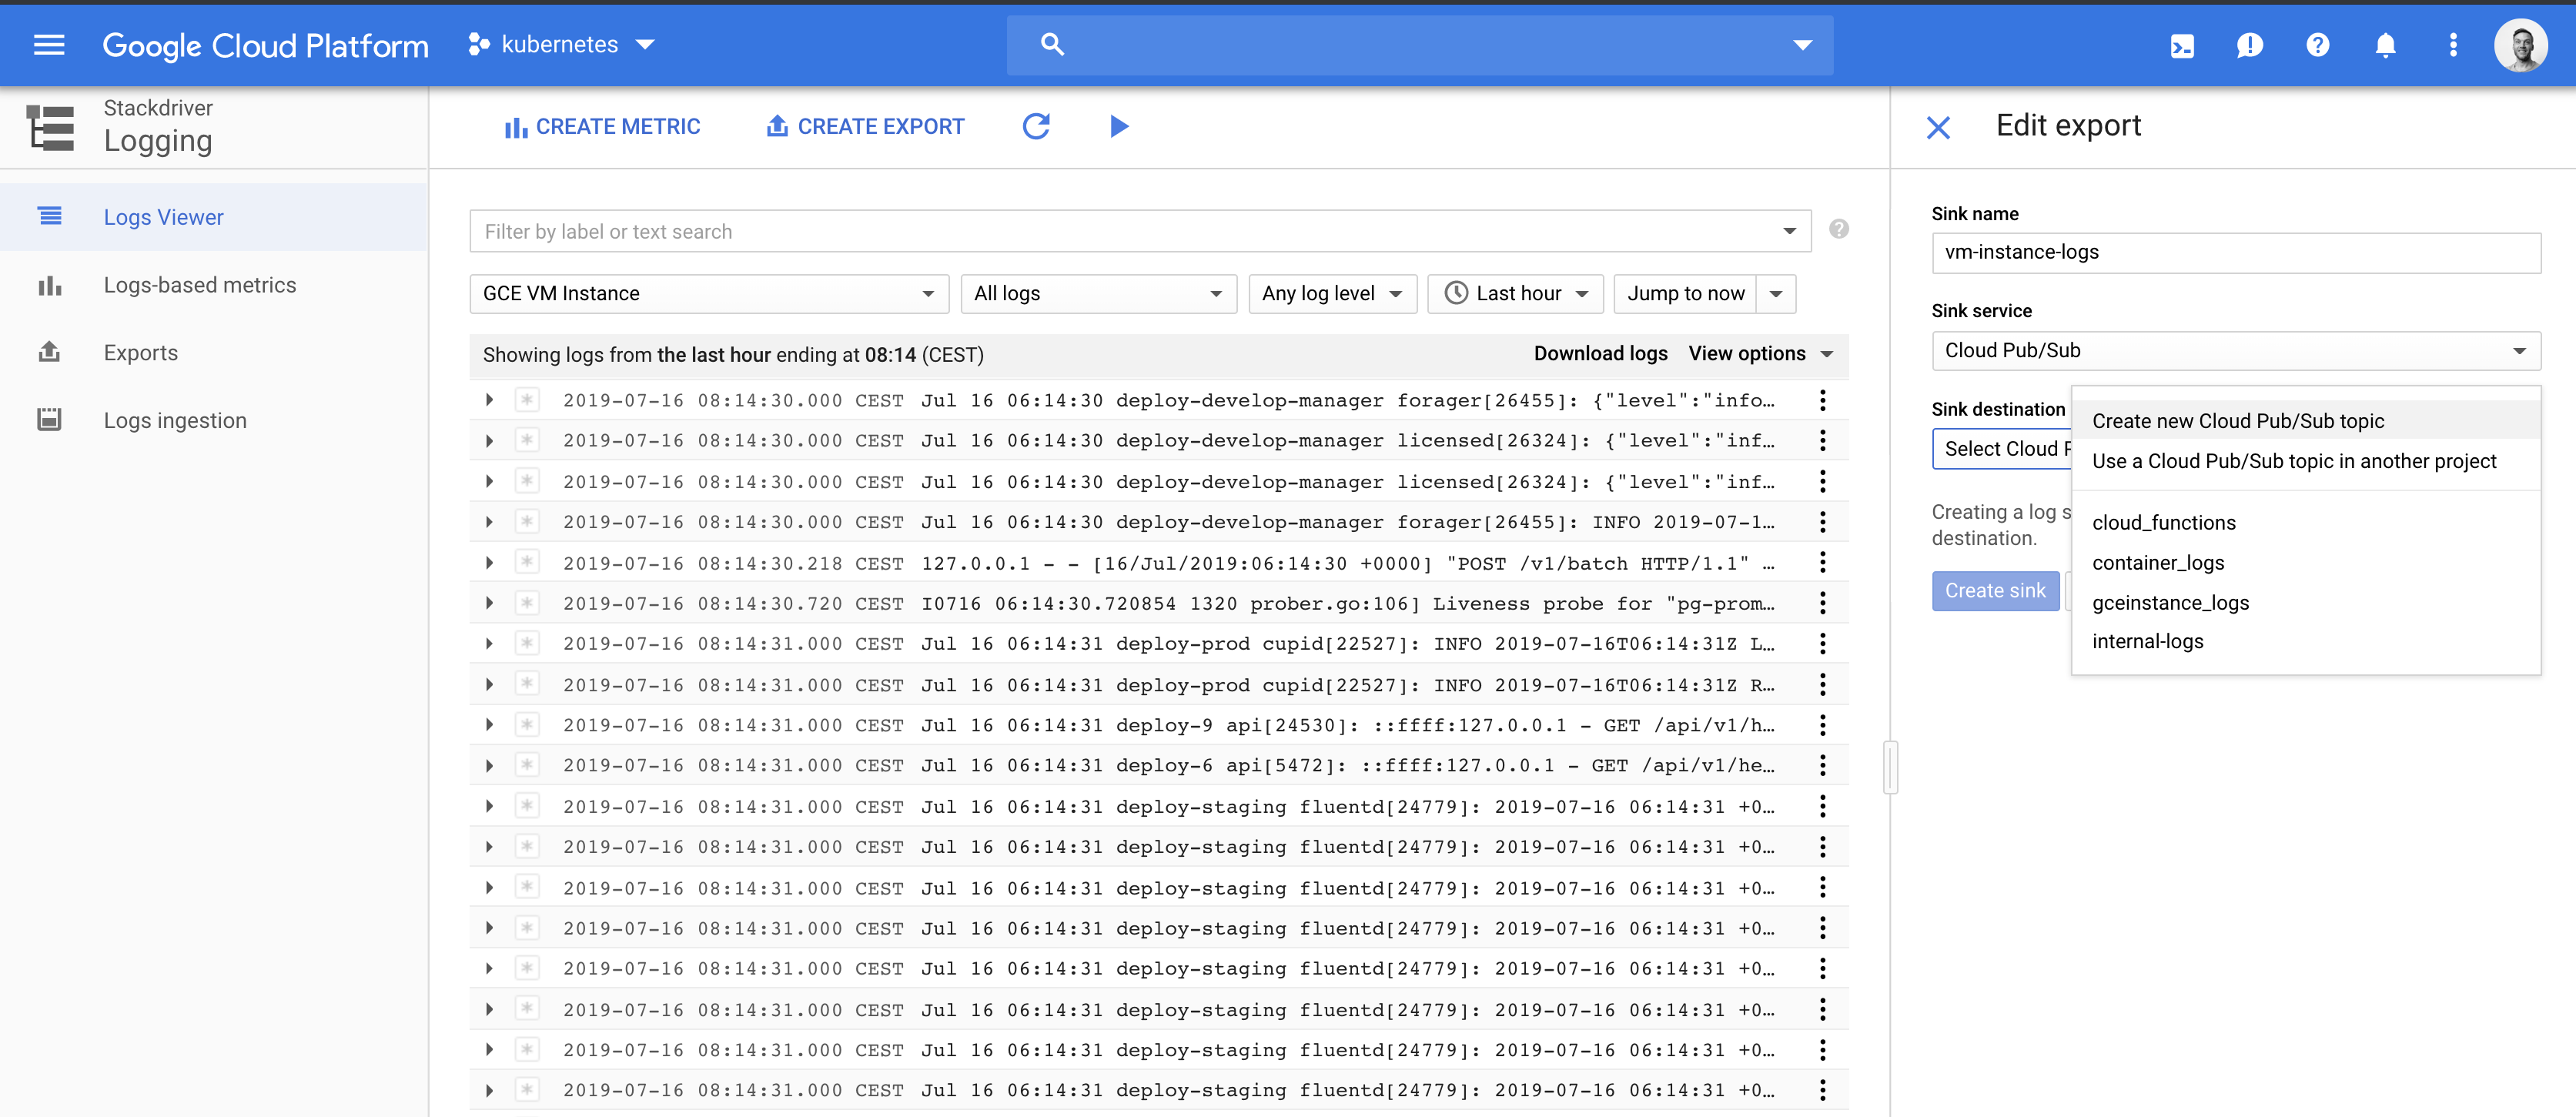
1. Expose resource logs
Stackdriver enables you to expose logs to a pubsub topic that we can they subscribe to.
Export logs to a new pubsub topic
Go to Stackdriver logging > Exports and choose CREATE EXPORT to create an export.
In this example, we want to expose all virtual instance logs to a topic. To do this we apply a filter to select all logs from resource type Virtual instance. (The same would apply for other resource types).
2. Setup permissions
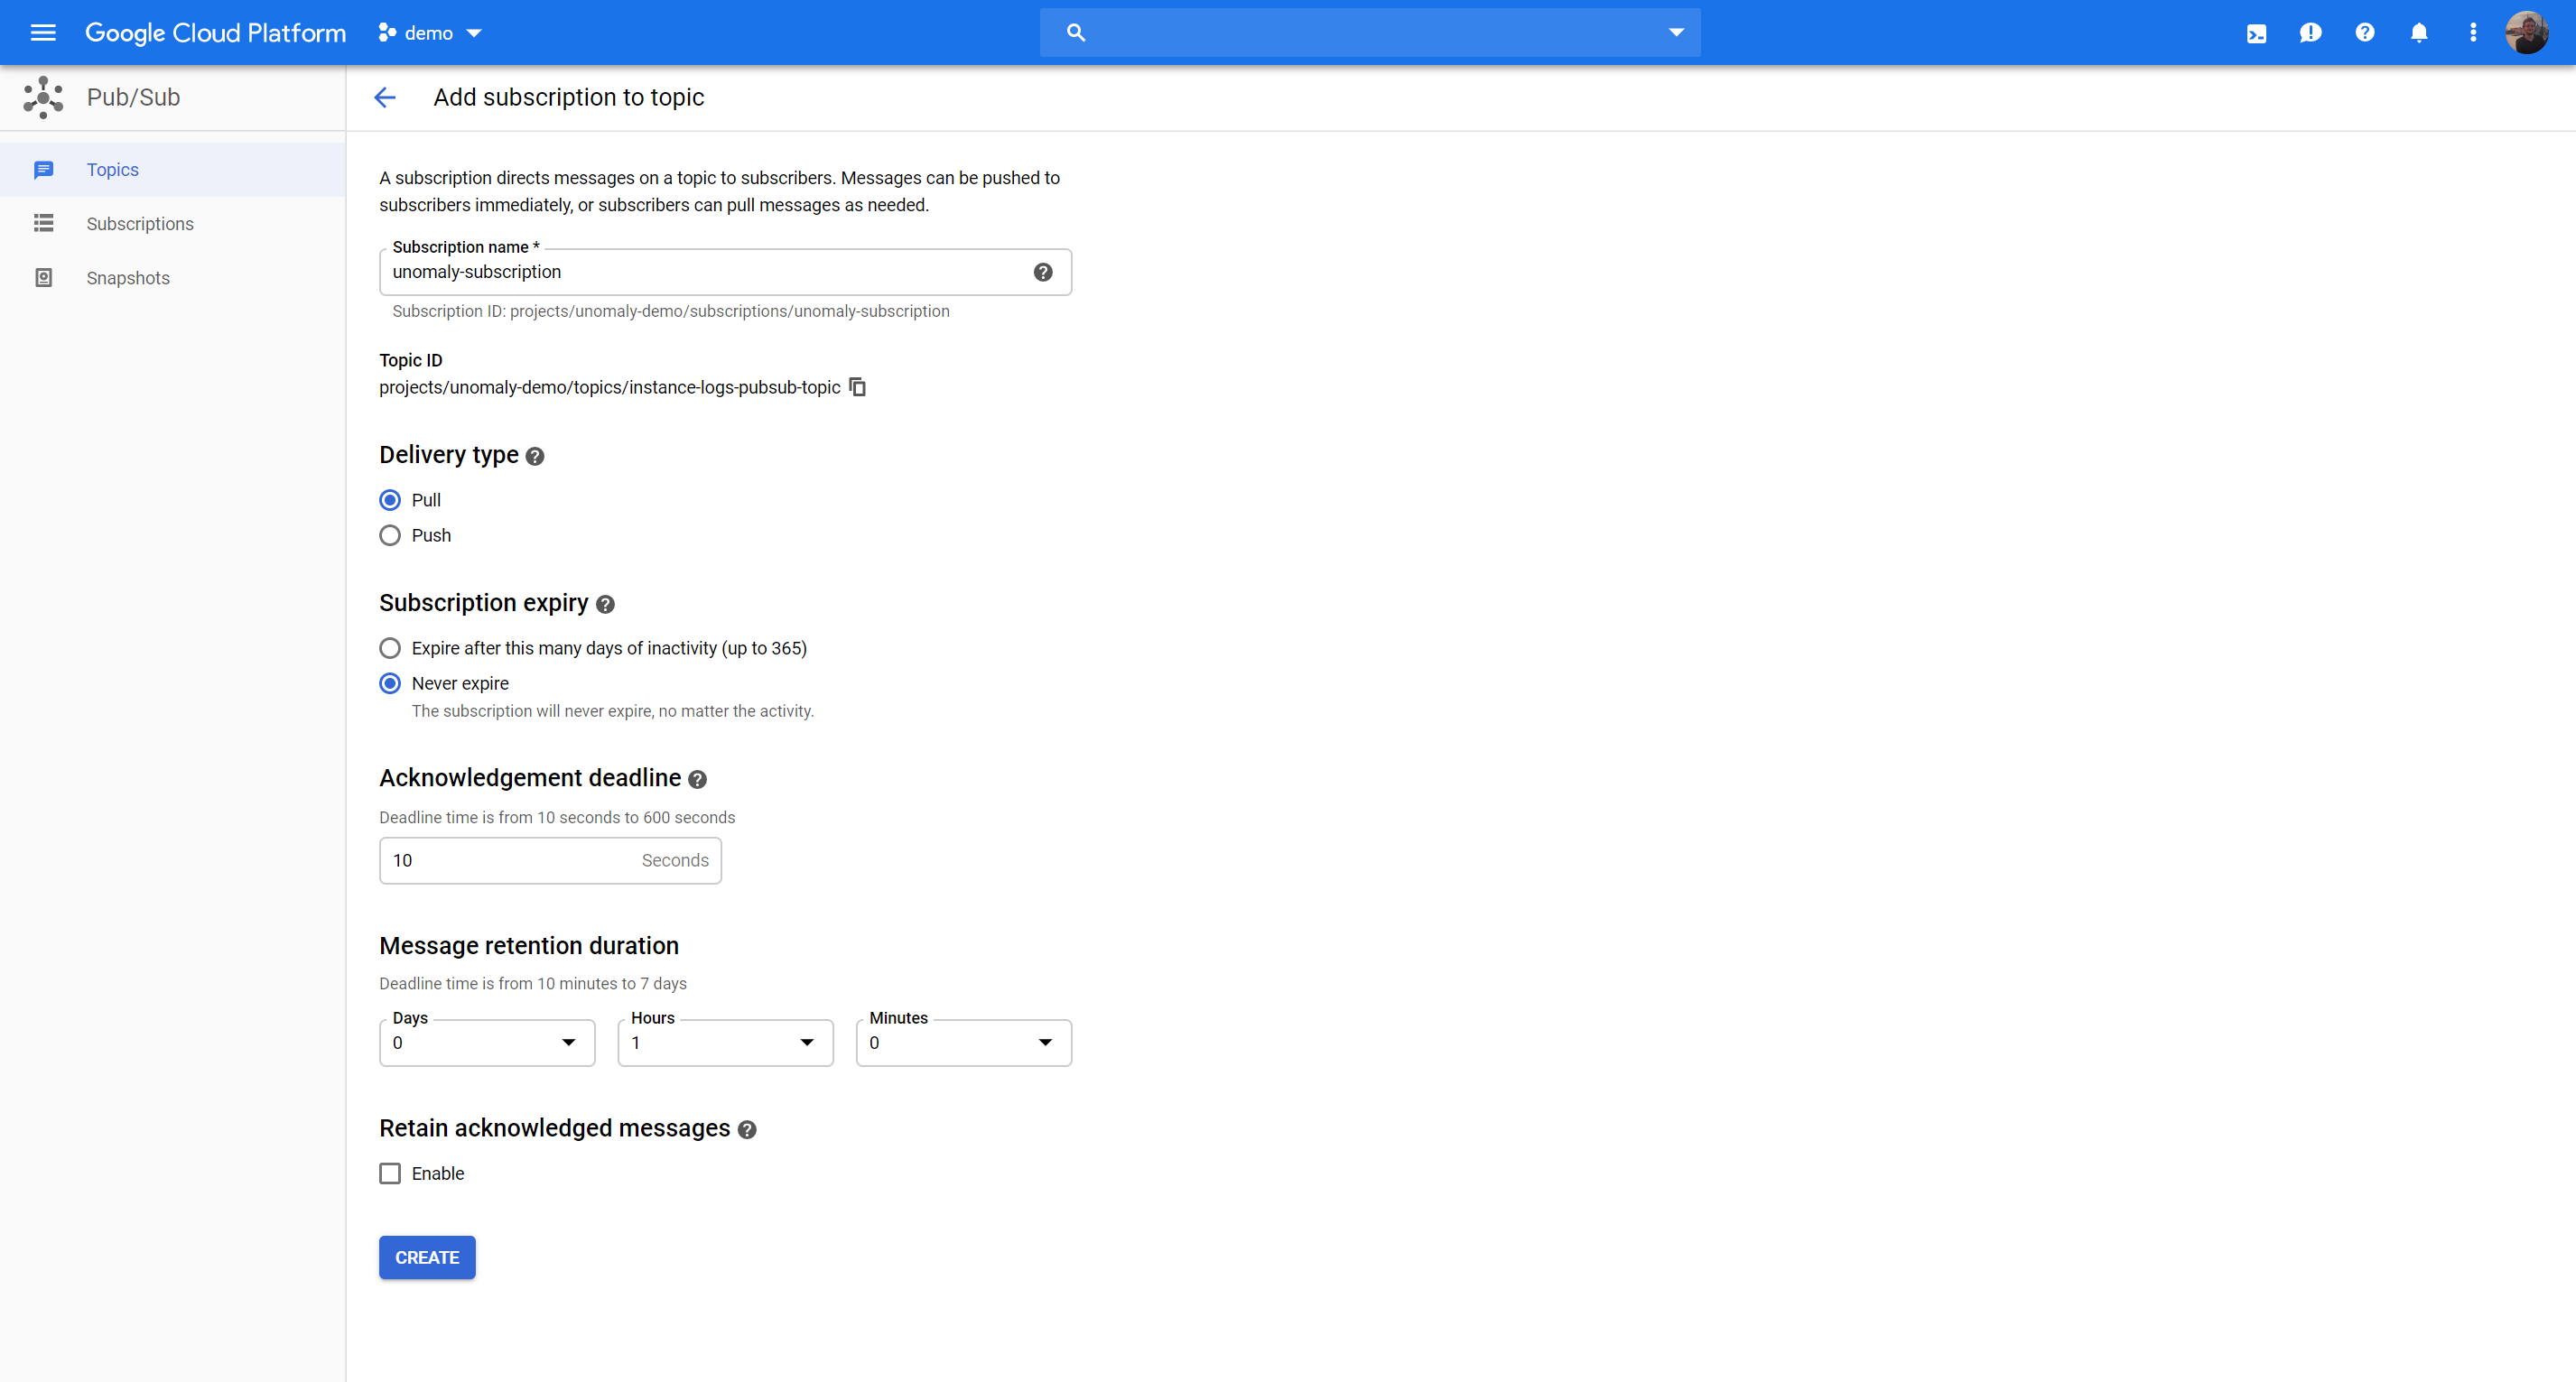
Configure the pubsub endpoint
This means you now have created a PubSup Sink where these logs are located. Now you need to configure the Pubsub endpoint to allow Unomaly to pull from this.
Go to Big Data > Pubsub > Topics
Then click the hamburger menu and choose Create subscription
Create service account
Go to IAM Admin > Service Accounts > Create Service account
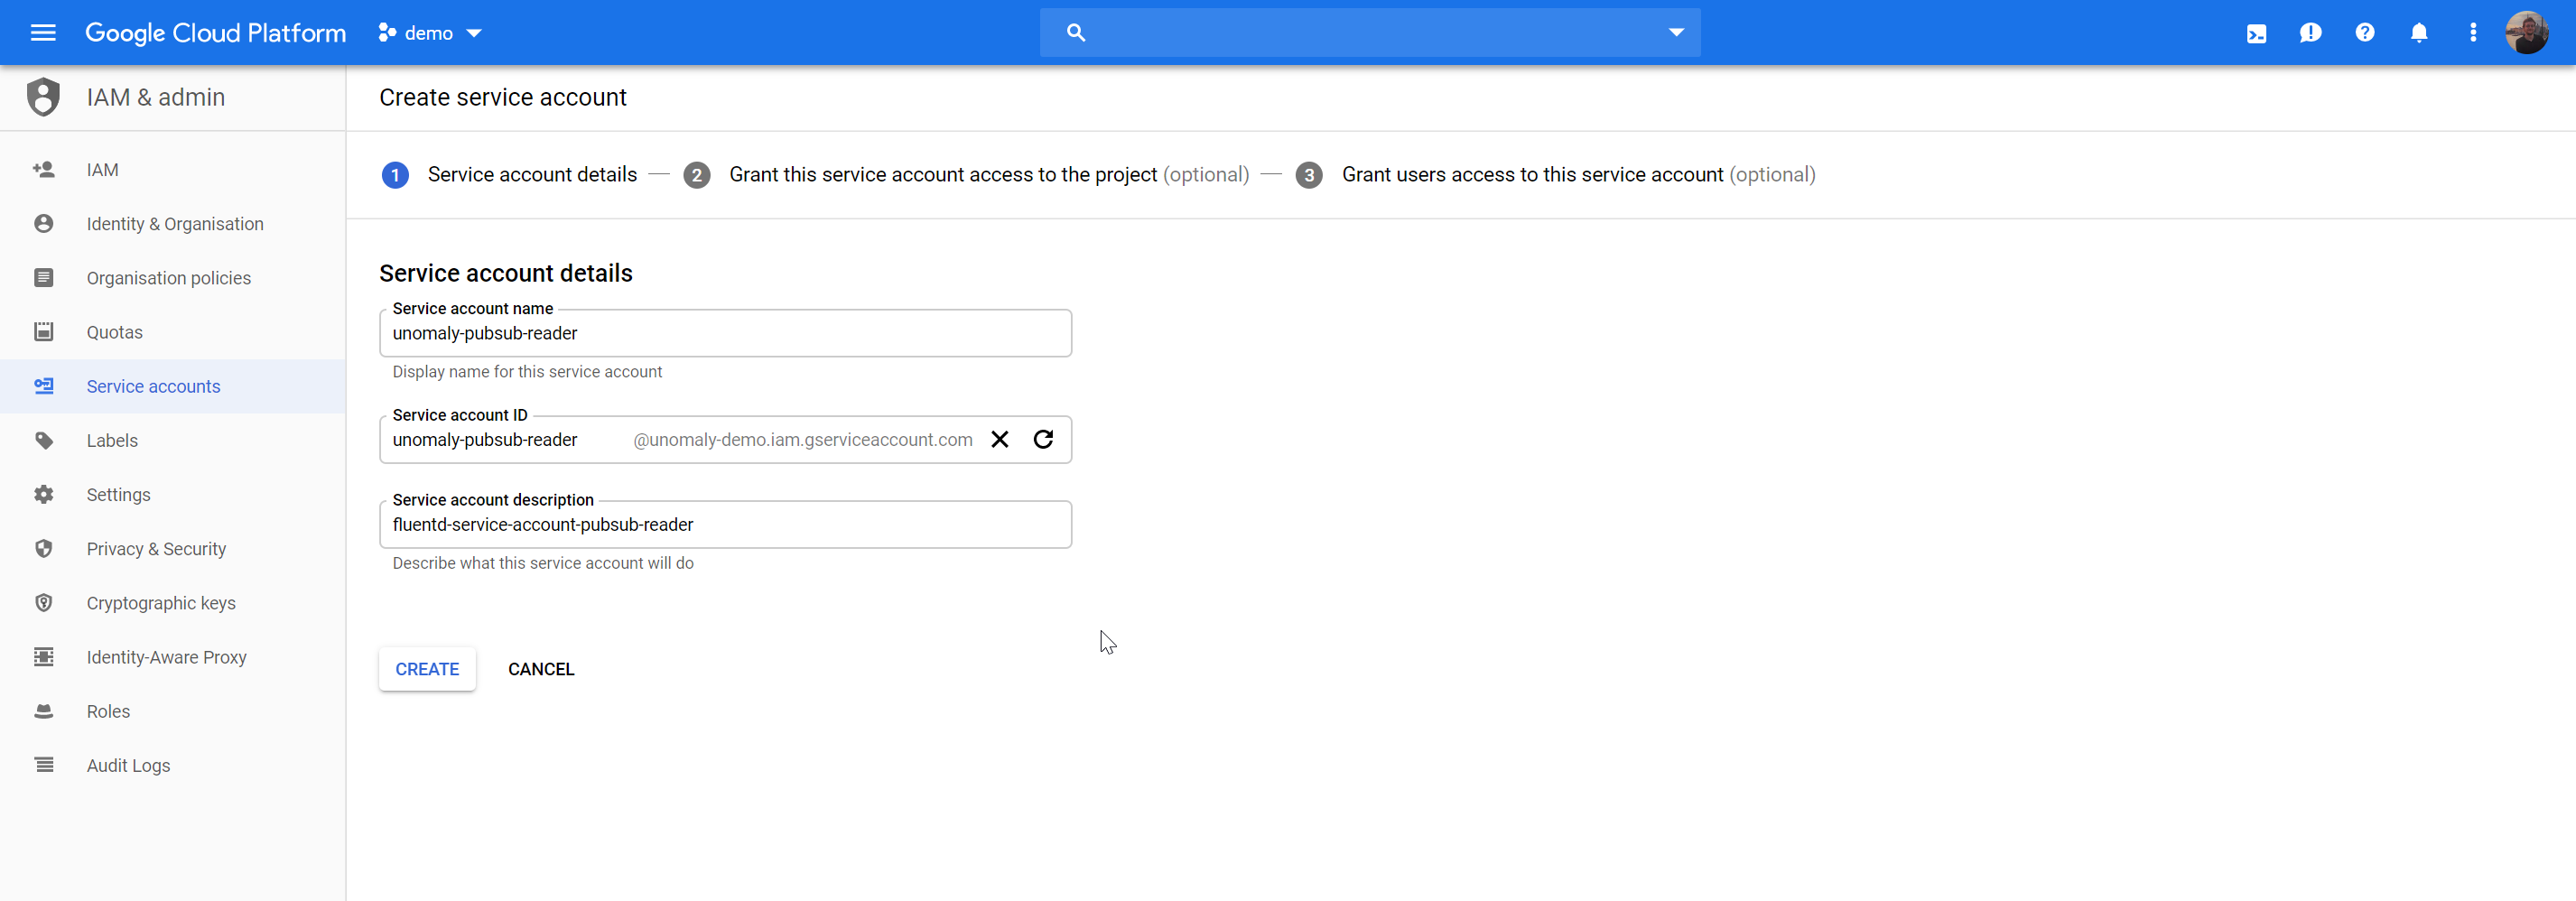
Save and edit, then choose Create Key. Download as Json
Add the permissions for this service account to read pubsub topics:
Go to IAM Admin > Click Add
Add member to your project by searching for you new service account.
Chose role Pubsub Subscriber
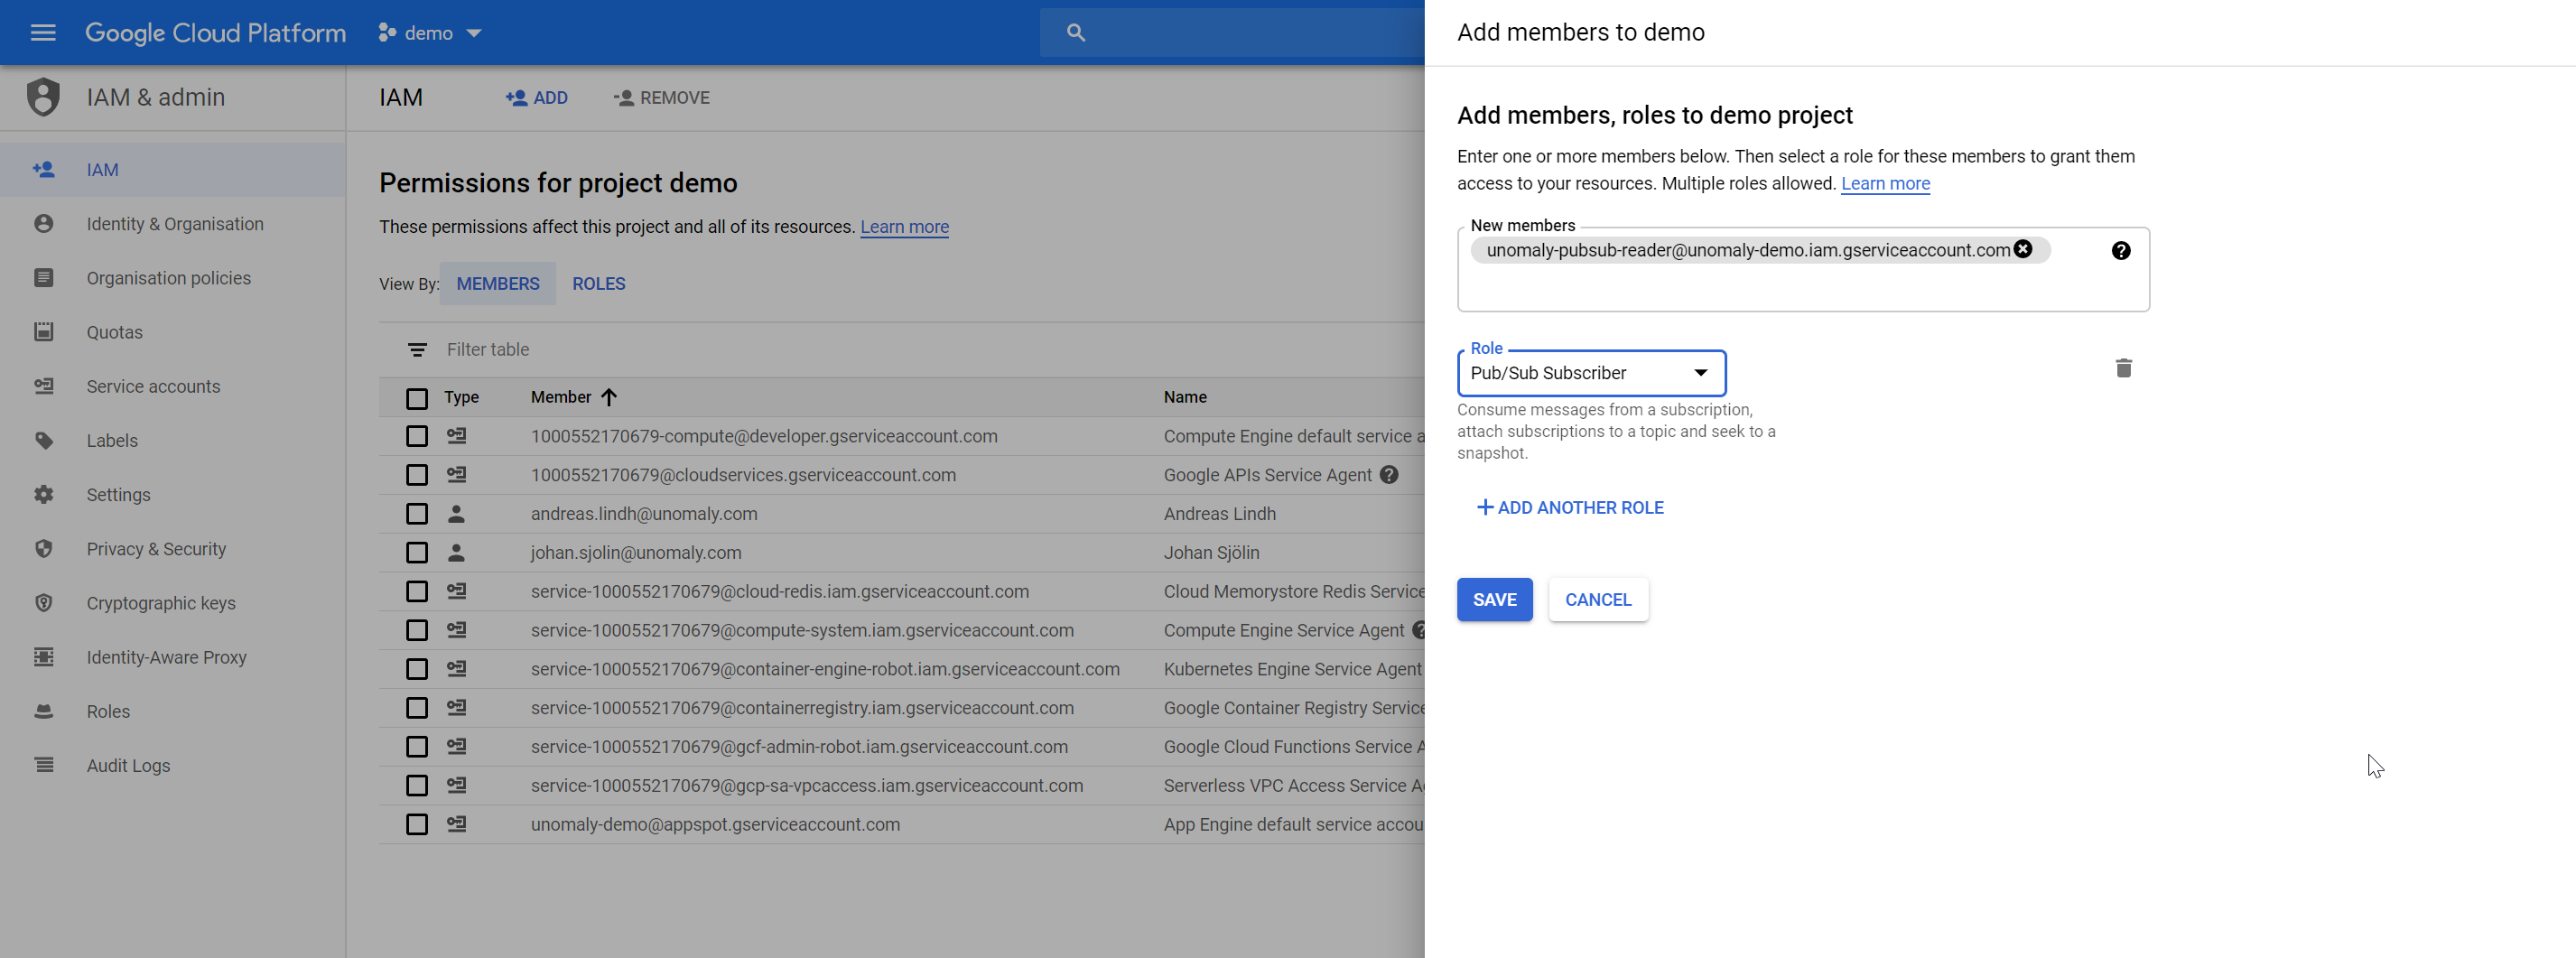
This means that this service account can subscribe to pubsub topics in this project. We will be using the json file you downloaded in Fluentd configuration file below.
3. Configure Unomaly to feed of pubsub topic
Use Fluentd to pull data from the pubsub topic ingest it into Unoamly using the Unomaly-Fluentd-plugin. See the following GitHub repo with configuration examples and a docker file for building the container to pull the logs.
Note: For the sake of simplicity, we are here outlining how you would run Fluentd on the Unomaly instance itself. Although in a production deployment or at scale it would be better to run this outside of the instance.
Place the configuration somewhere and move the service account json file to this destination:
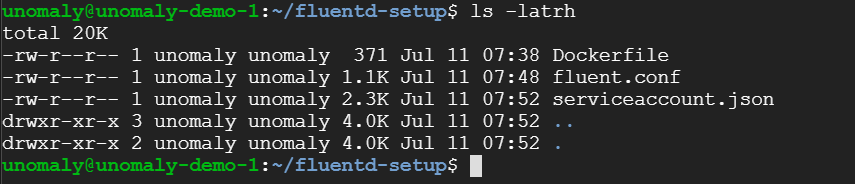
Adjust the configuration for your environment
Edit the fluentd configuration file and adjust the following parameters to fit your environment:
- Set the correct service reference
- Project name
- Topic name
- Subscription id
- Unomaly instance destination
Build the docker container to run this
Add the following docker file to your Unomaly instance. Home directory works.
Dockerfile:
FROM fluent/fluentd:v1.3

RUN apk add --no-cache --update --virtual .build-deps \
        sudo build-base ruby-dev \
 && gem install fluent-plugin-gcloud-pubsub-custom fluent-plugin-unomaly \
 && sudo gem sources --clear-all \
 && apk del .build-deps \
 && rm -rf /tmp/* /var/tmp/* /usr/lib/ruby/gems/*/cache/*.gem

COPY fluent.conf /fluentd/etc/
COPY serviceaccount.json /fluentd/etc/
Then build it
docker build -t fluentd .
And run it
docker run -d fluentd
Verify that it is working by checking that it runs
docker ps | grep fluentd
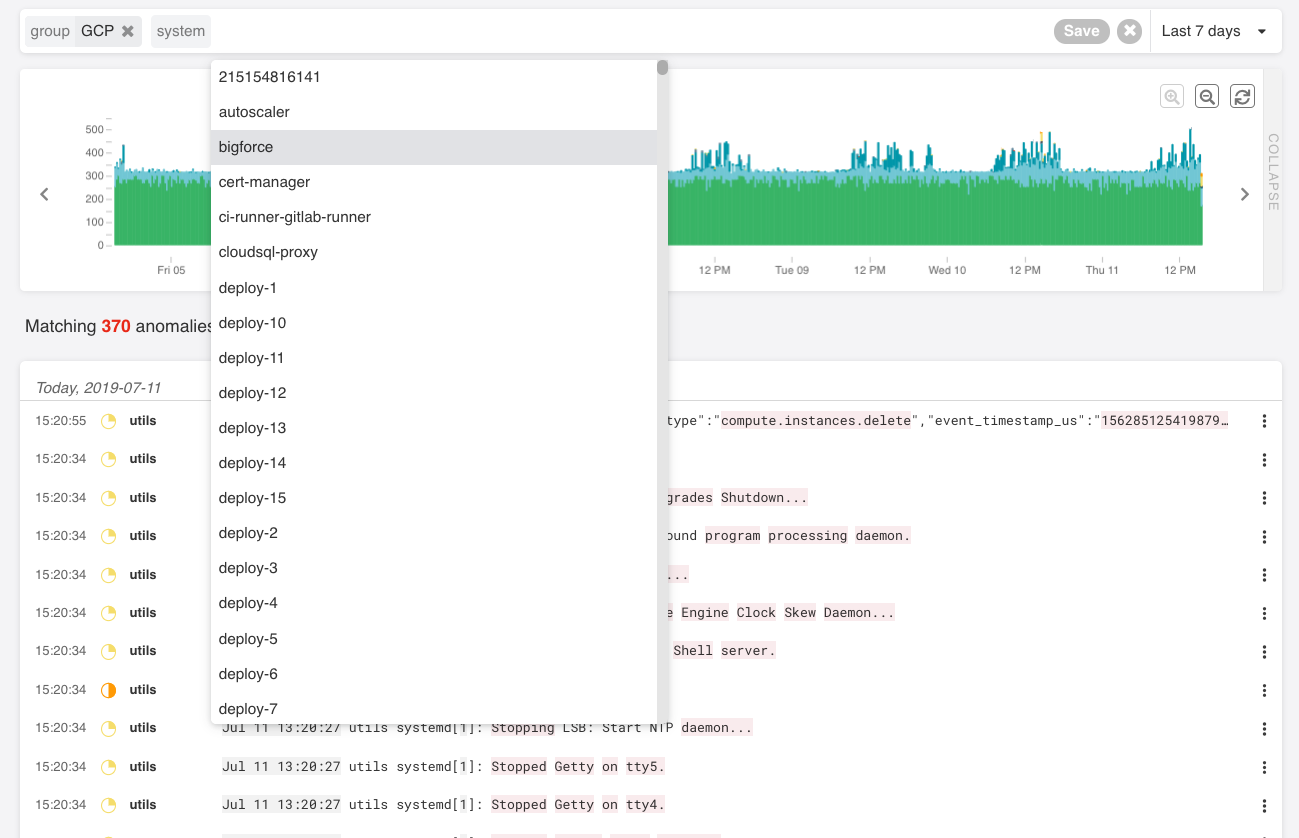
4. Observe the results in Unomaly
Once the pipeline is setup, you should be seeing new entities showing up in Unomaly. You can see that in the Systems view: